Analysing motivation in Relay Swimming

Just like in track and field, many any elite swimmers who specialise in a certain event also swim the corresponding relay leg with their country’s team at major swimming meets. If you’re into swimming, you might ask yourself, could there be a significant difference between swimmers’ performances in their solo races and in their relay legs? If so, this could be interpreted as swimmers being more or less motivated to swim relays than solo races. We first scrape public swimming data from the web with Python and SQL, then carry out exploratory data analysis again using Python, and finally statistical modelling using R, in order to find out how such differences in performance are reflected across different subcategories of swimmers broken down according to several criteria (such as event speciality, national swimming tradition, age, etc.).

This three-part study is meant to be a capstone project showcasing the author’s mastery of the basics of data scraping, SQL database management, exploratory data analysis and statistical modelling using the programming languages Python and R. The code and text for each part were written using Jupyter Notebooks.

The topic of this study stems from the author’s interest in the sport of swimming, which is currently living exciting times, especially with the 2024 Paris Olympics coming up.

Python keywords:#BeautifulSoup #SQLAlchemy #Pandas #Plotly
R keywords: #LogisticRegression #DevianceResiduals #RandomForests #GradientBoosting #K-FoldCrossValidation #ROC-AUC

scraping_cropped
PART 1: DATA SCRAPING
The first part of this project presents how the data used in the project was scraped from the web. Unlike part 2 and 3, this part will not be extensively commented, only the main ideas behind how the code was structured will be explained. The code itself contains many comments explaining the actions within each code block. Also, the whole structure…
kapla_analysis
PART 2: EXPLORATORY DATA ANALYSIS
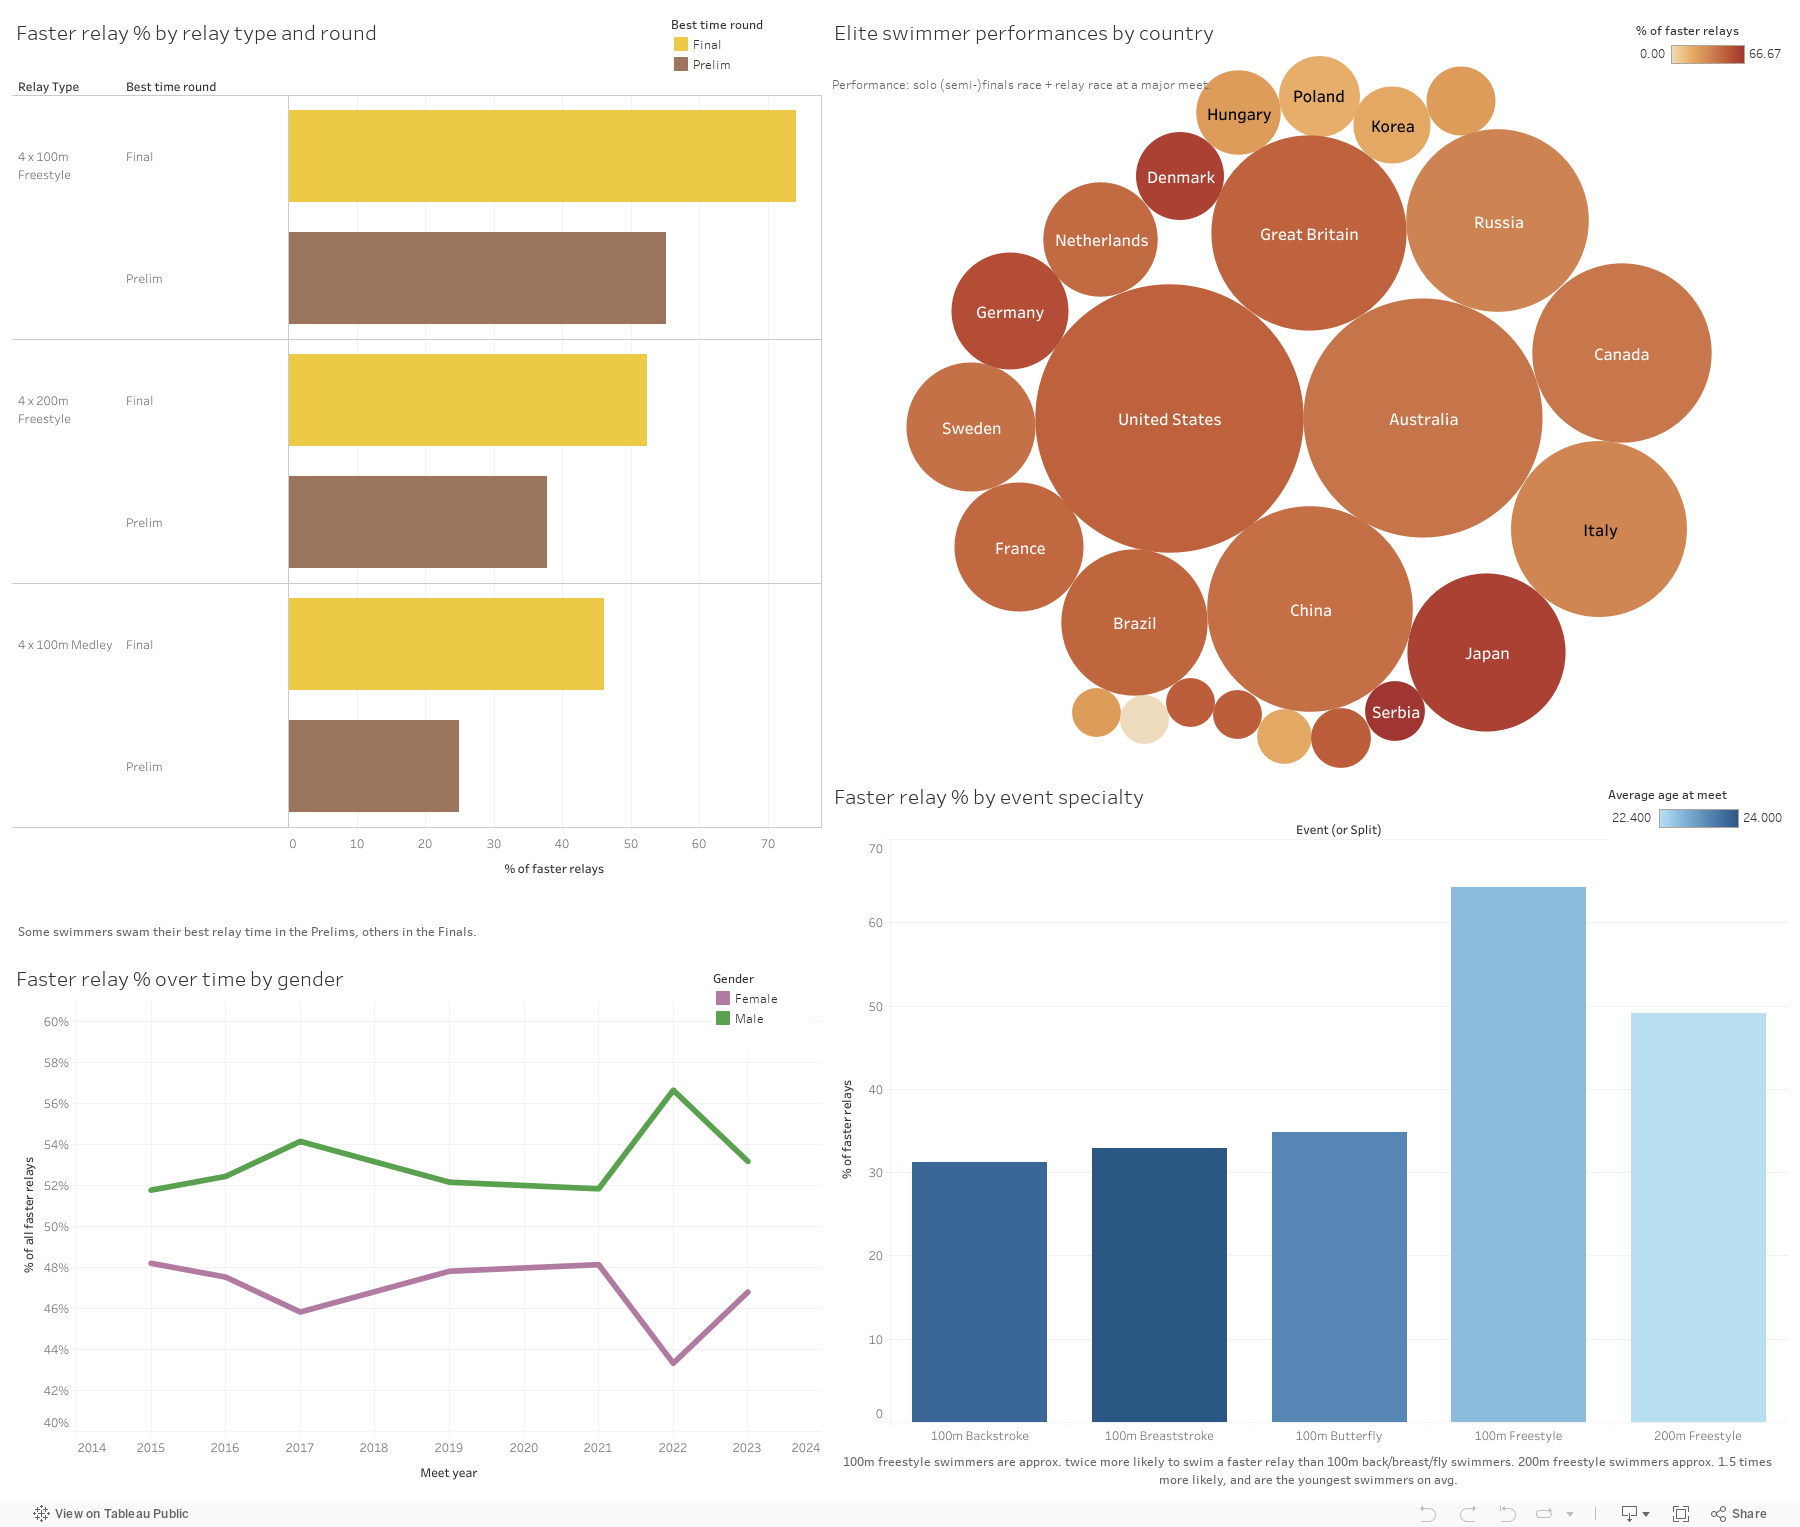
In the second part of this project, we will carry out exploratory data analysis on the data we collected in part 1. This EDA part consists of two main sections: organising and preparing the dataframes for visualisation using Pandas, and data visualisation using Pandas and Plotly. The main goal of this analysis is to find out if swimmers are faster in…
Untitled-design
PART 3: STATISTICAL MODELLING
This third and final part of the project follows the EDA part, and intends to dig deeper into the findings made in that EDA. In the first section, we build our statistical model, which includes defining the model, assessing its goodness of fit with various methods, and eventually refining the model; and in the second section, the final model is validated…

The Tableau dashboard below summarises some key insights yielded by the exploratory analysis of our data set (scroll down and to the right to see the entirety of the dashboard). This dashboard contains four charts, each one showcasing unique insights into the behaviour of elite swimmers (who reached at least the semi-finals of their event) at major swimming meets (long course World Championships and Olympic Games). It is important to note that due to the fairly small size of our data set (780 observations of paired solo & relay races) and some extreme values having very few observations (such as the countries with the smallest bubbles in the dashboard) the insights communicated in this dashboard and the project in general cannot be accurately generalised.

The first bar chart shows us that elite swimmers who did their best relay time in the Finals of the relay are more likely to have outperformed their solo race time, and 4 x 100m freestyle swimmers are more motivated to surpass themselves during relays than swimmers doing the other two types of relay.

The packed bubbles chart helps us see at a glance whether the swimming tradition of a country has an impact on the motivation of athletes to swim faster relays. The size of the bubbles (number of elite swimmer appearances at major meets) measures the strength of the national swimming tradition: the more elite swimmer performances a country has, the stronger the tradition is. At first sight, it does not look like the national swimming tradition has a significant (positive or negative) impact on the motivation to swim faster relays.

The line chart at the bottom left shows the gender proportions of faster relays over time: the difference is overall too thin to consider female and male elite swimmers as two statistically different populations.

Finally, the bar chart at the bottom right dissects the different events to get more granular insights on the five event specialties: backstroke, breaststroke and butterfly  swimmers all seem to belong to the same population; while 100m freestyle swimmers clearly belong to a different population of swimmers more motivated by relays; it is also tempting to classify the 200m freestylers as a different population than the first three – go take a look at the statistical modelling part of the project to find out!