Python… R… Tableau… three words that often come to mind when hearing “data analysis”. In this section, exploratory data analysis, statistical data analysis, and comprehensive data visualisation projects you will find.
my Flipside dashboards: https://flipsidecrypto.xyz/chainrunner_
my Dune Analytics dashboards: https://dune.com/chainrunner_
Highlight projects
A blockchain data dashboard with Snowflake SQL –
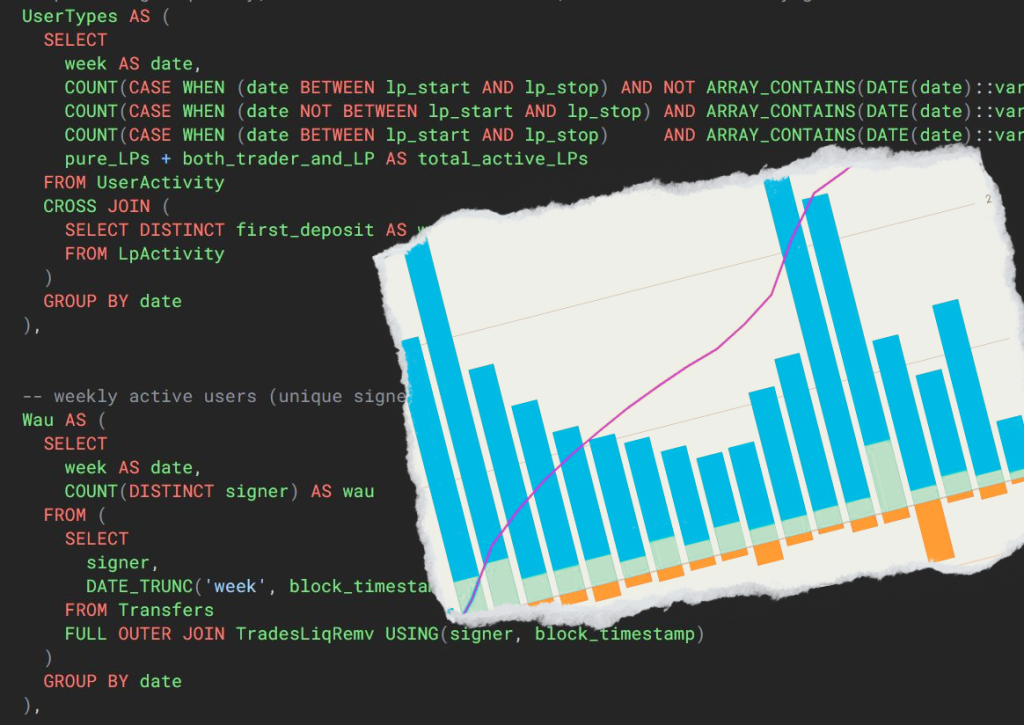
“The blockchain remembers”, as crypto bros like to say. All past transactions on the blockchain are accessible for everybody in the world to inspect, and Flipside aggregates them into different raw tables (general transactions, transfers, NFT transactions, etc.), from which one can extract specific insights with Snowflake SQL queries, and create data visualisations. Click on the button below to see the data dashboard I did for Parcl, a real estate perpetual futures exchange on Solana (click on charts/query table to see my code).
Keywords: #SQL #Snowflake
Capstone project: Analysing motivation in relay swimming (October 2023) –

Just like in track and field, many any elite swimmers who specialise in a certain event also swim the corresponding relay leg with their country’s team at major swimming meets. If you’re into swimming, you might ask yourself, could there be a significant difference between swimmers’ performances in their solo races and in their relay legs? If so, this could be interpreted as swimmers being more or less motivated to swim relays than solo races. In this study consisting of three parts, we first scrape public swimming data from the web with Python and SQL, then carry out exploratory data analysis again using Python, and finally statistical modelling using R, in order to find out how such differences in performance are reflected across different subcategories of swimmers broken down according to several criteria (such as event speciality, national swimming tradition, age, etc.).
Keywords: #Python #R #SQL #Tableau